Edit (three hours after publishing the first version): Added the hint for 21-Down and added a number (19b) and a hint for it.
Edit February 12: I posted the solution! Find it here.
Yesterday morning, my partner Jonathan and I solved a crossword puzzle over breakfast. We normally don’t do that. Jonathan picked up a copy of “Arts of the Working Class”, a curious, free newspaper. He likes to read the editorial – but in this issue, half the editorial had gone missing and instead, we were confronted with a crossword. And while we solved clues and put in words like “Marxism” and “Cybernetics”, we were surprised about how much we actually enjoyed it.
And I got an idea: A crossword for the data vis field! That’s what the world needs! Or maybe not, but here it is anyway!
You can download it here as a PDF, then print it (it’s in A4), or solve it in your favorite graphics software.
How it works and what to win
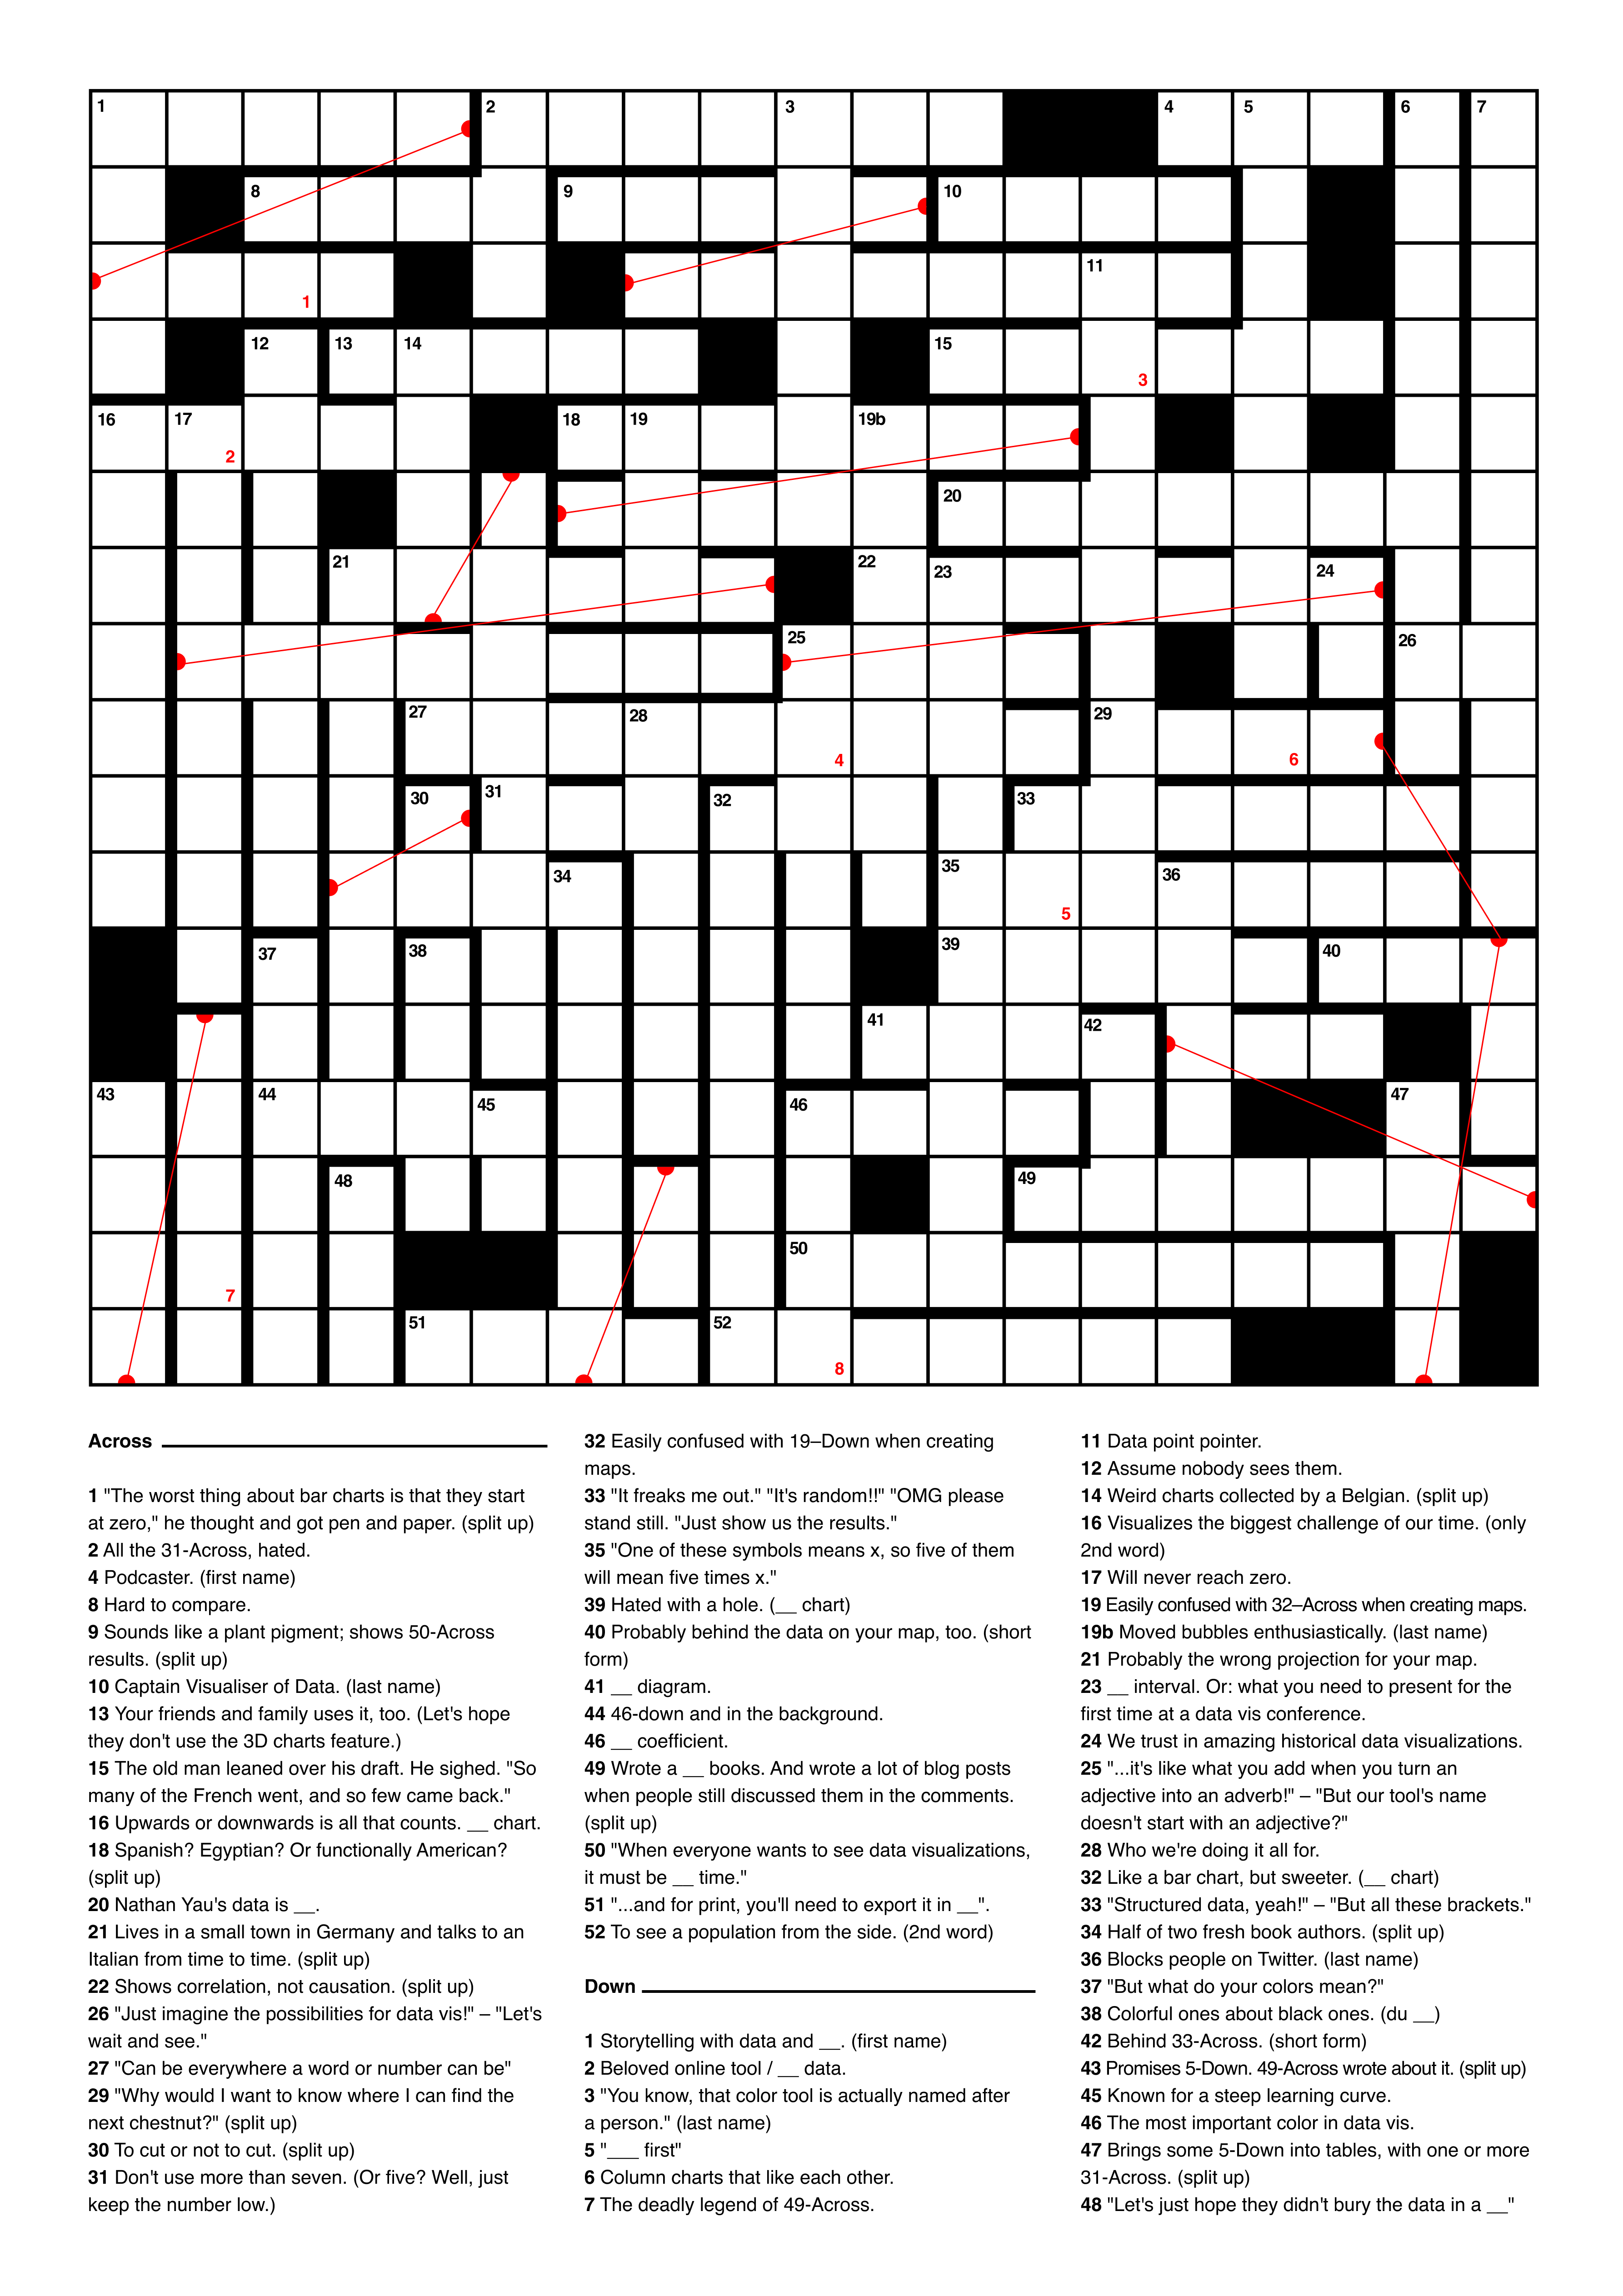
It works mostly like a normal crossword: Solve the clues below and put in the right words, across (from left to right) and down (from top to bottom). There are two odd elements, though:
- The thick black lines are borders – there’s no connection to the next square. For example, 12 only goes down, not across. And 13 only goes across, not down. (Yes, that’s because I’m not a professional crossword designer. You’ll even find words that have no connection to other words whatsoever! 😱)
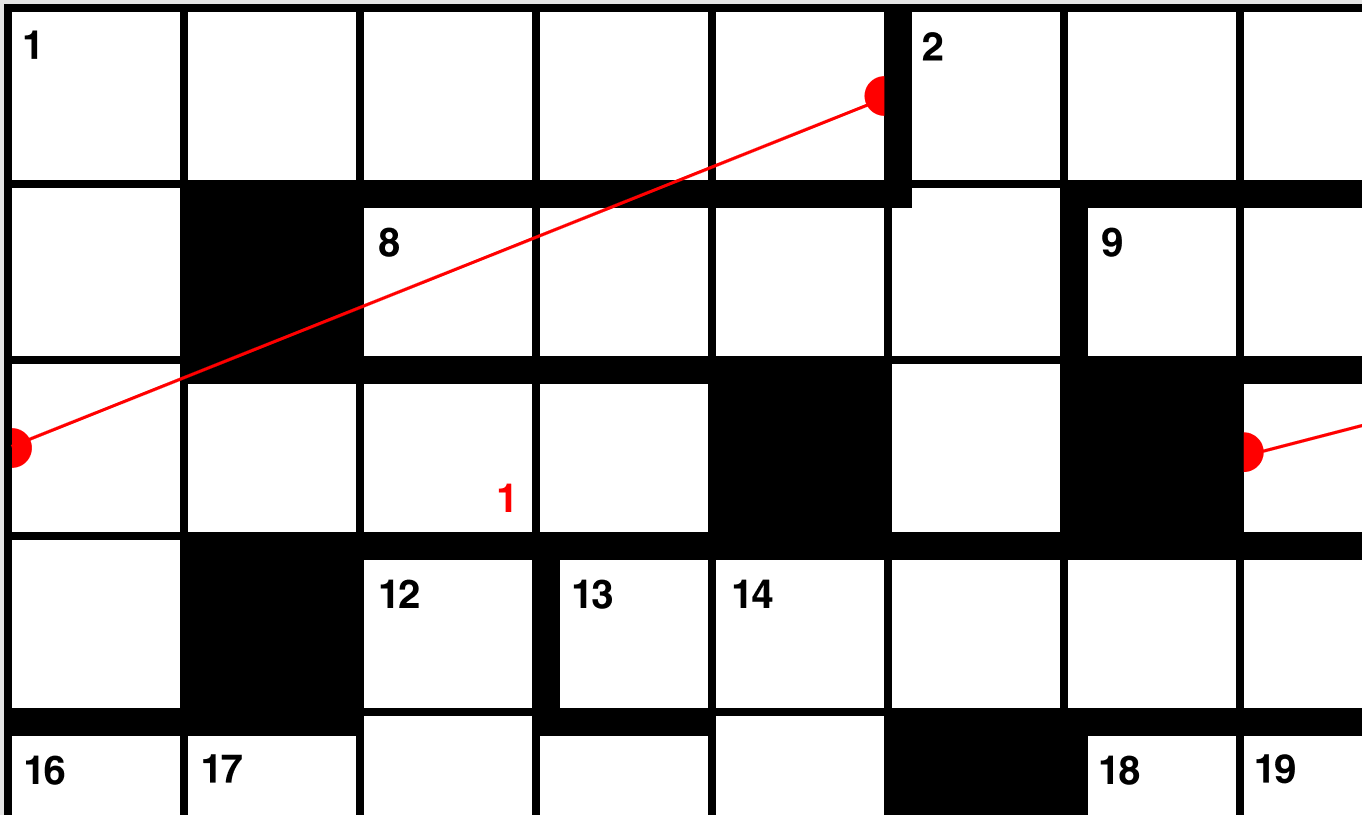
- The data vis field has some looong words. I split them up. The red lines show you where one part of the word (or name) ends and where the next one begins. The direction (down or across) always stays the same. For example, 1–Across goes five letters across and then continues in row three with four more letters. The clues have a “split up” hint if they are split up like this.
The squares with the red number in the lower-right (in the example above, you can see the 1 in the third row and third column) will give you the eight letters in the right order that you need to enter the ranking list, like so:
bit.ly/_ _ _ _ _ _ _ _
(The letters are uppercase in the URL! Also, it’s not a phrase that makes sense. I don’t like these crossword puzzles where you only need to solve half of the solution to guess the rest.)
This URL will lead to a Google survey. Put your name in there, and you’ll get the link to the Google survey results – which will be the ranking!
Let’s make that a bit more competitive: If you’re the first to put your name on that ranking, I’ll get in touch with you and you’ll receive 🎉 a data vis book of your choice 🎉 (50 Euro or less incl. shipping). If you don’t want a book, you can tell me and I’ll give it to the 2nd place, and then 3rd place, etc.
Here are the clues:
Across
1 – “The worst thing about bar charts is that they start at zero,” he thought and got pen and paper. (last name, split up)
2 – All the 31-Across, hated.
4 – Podcaster. (first name)
8 – Hard to compare.
9 – Sounds like a plant pigment; shows 50-Across results. (split up)
10 – Captain Visualiser of Data. (last name)
13 – Your friends and family uses it, too. (Let’s hope they don’t use the 3D charts feature.)
15 – The old man leaned over his draft. He sighed. “So many of the French went, and so few came back.” (last name)
16 – Upwards or downwards is all that counts. chart.
18 – Spanish? Egyptian? Or functionally American? (split up)
20 – Nathan Yau’s data is .
21 – Lives in a small town in Germany and talks to an Italian from time to time. (split up)
22 – Shows correlation, not causation. (split up)
26 – “Just imagine the possibilities for data vis!” – ”Let’s wait and see.”
27 – “Can be everywhere a word or number can be”
29 – “Why would I want to know where I can find the next chestnut?” (split up)
30 – To cut or not to cut. (split up)
31 – Don’t use more than seven. (Or five? Well, just keep the number low.)
32 – Easily confused with 19–Down when creating maps.
33 – “It freaks me out.” “It’s random!!” “OMG please stand still. “Just show us the results.”
35 – “One of these symbols means x, so five of them will mean five times x.”
39 – Hated with a hole. ( chart)
40 – Probably behind the data on your map, too. (short form)
41 – diagram.
44 – 46-down and in the background.
46 – coefficient.
49 – Wrote a books. And wrote a lot of blog posts when people still discussed them in the comments. (split up)
50 – “When everyone wants to see data visualizations, it must be time.”
51 – “…and for print, you’ll need to export it in ”.
52 – To see a population from the side. (2nd word)
Down
1 – Storytelling with data and . (first name)
2 – Beloved online tool / data.
3 – “You know, that color tool is actually named after a person.” (last name)
5 – “ first”
6 – Column charts that like each other.
7 – The deadly legend of 49-Across.
11 – Data point pointer.
12 – Assume nobody sees them.
14 – Weird charts collected by a Belgian. (split up)
16 – Visualizes the biggest challenge of our time. (only 2nd word)
17 – Will never reach zero.
19 – Easily confused with 32–Across when creating maps.
19b – Moved bubbles enthusiastically. (last name)
21 – Probably the wrong projection for your map.
23 – interval. Or: what you need to present at a data vis conference for the first time.
24 – We trust in amazing historical data visualizations.
25 – “…it’s like what you add when you turn an adjective into an adverb!” – “But our tool’s name doesn’t start with an adjective?”
28 – Who we’re doing it all for.
32 – Like a bar chart, but sweeter. ( chart)
33 – “Structured data, yeah!” – “But all these brackets.”
34 – Half of two fresh book authors. (split up)
36 – Blocks people on Twitter. (last name)
37 – “But what do your colors mean?”
38 – Colorful ones about black ones. (du )
42 – Behind 33-Across. (short form)
43 – Promises 5-Down. 49-Across wrote about it. (split up)
45 – Known for a steep learning curve.
46 – The most important color in data vis.
47 – Brings some 5-Down into tables, with one or more 31-Across. (split up)
48 – “Let’s just hope they didn’t bury the data in a “
The quotes are not original except one, 27-Across.
Some more hints (= very light spoilers)
The crossword reveals 13 vis types, five tools, 14 people, and 22 concepts from the field of data visualization. If you can’t figure out a word, this list might help:
Visualization types: 9-Across, 16-Across, 22-Across, 27-Across, 29-Across, 39-Across, 41-Across, 52-Across, 6-Down, 7-Down, 16-Down, 32-Down, 47-Down
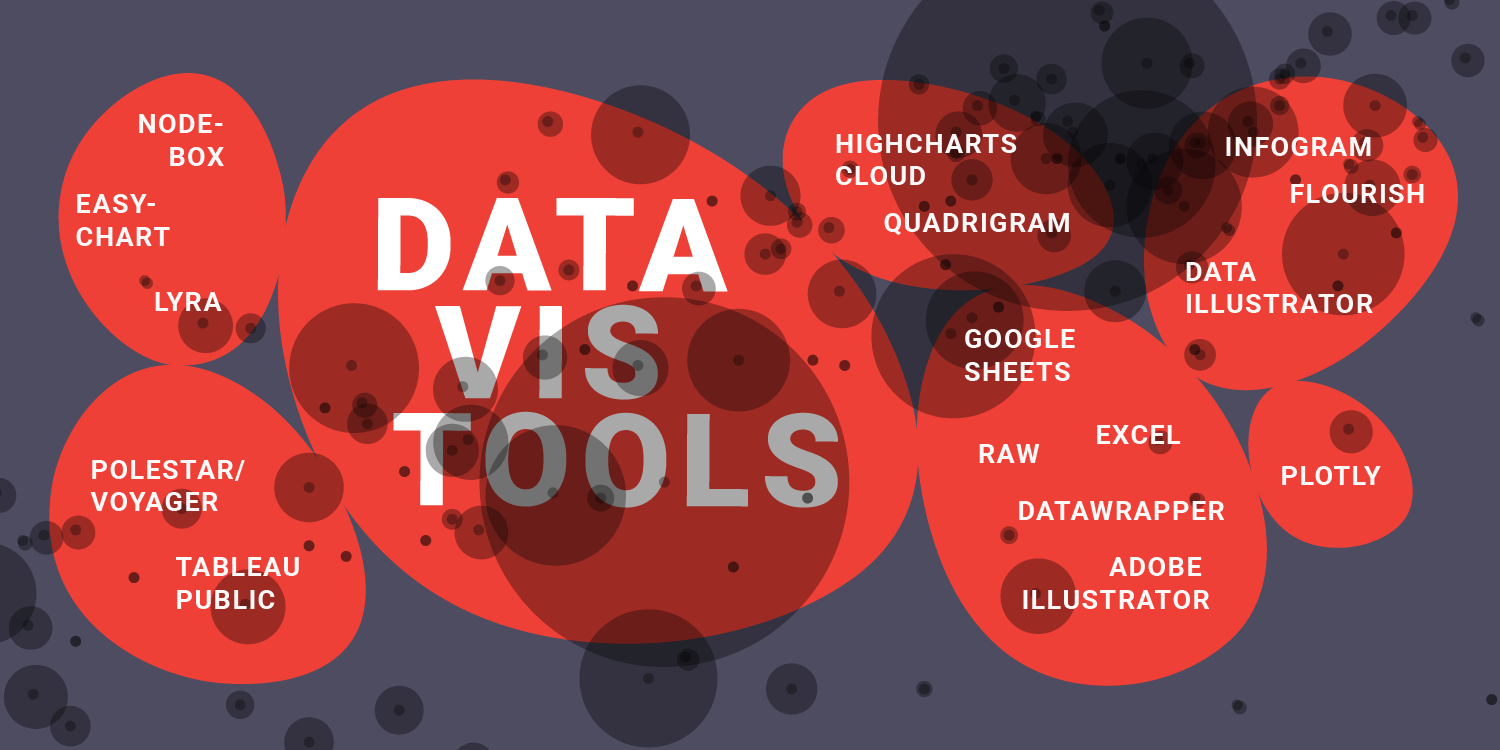
Tools (not necessarily pure data vis tools): 13-Across, 40-Across, 2-Down, 25-Down, 45-Down
People (current and historical ones): 1-Across 4-Across, 10-Across, 15-Across, 18-Across, 21-Across, 49-Across, 1-Down, 3-Down, 24-Down, 28-Down, 34-Down, 36-Down, 38-Down
Concepts (e.g. data visualization elements): 2-Across, 8-Across, 20-Across, 26-Across, 30-Across, 31-Across, 32-Across, 33-Across, 35-Across, 44-Across, 46-Across, 51-Across, 5-Down, 11-Down, 12-Down, 14-Down, 17-Down, 19-Down, 23-Down, 37-Down, 43-Down, 46-Down
Sooo…how easy is it to solve?
I hope there are some words that are easy to solve for everyone with an interest in data visualization. If you want to solve all of them, you’ll probably need to follow some data vis people on Twitter, have read a data vis book or three and have gone to a data vis conference.
I don’t normally solve crossword puzzles. And I never designed one. So when writing the clues, I wasn’t sure if they’re too hard or to easy. I erred on the side of “too hard”, to make it a challenge for you all – and to give you some chance to collaborate! Ask around on Twitter, or find somebody to solve that puzzle with (I’m happy to send two books a 25 Euro, too).
Where’s the solution?
It’s not online yet. I’ll post it in a week or so!
Here’s the solution.
Happy crossword-solving! As always, find me on Twitter or via email: lisacharlotterost@gmail.com.


Comments