In April 2017 I started generating charts in R based on trigonometric functions like sin(x), tan(x) and cos(x). E.g., I would write plot(cospi(x*abs(tan(x)))*cos(x),sin(x) in R (after defining x and y as loooong arrays of numbers), and it would give me back a plot, that I then uploaded to a Tumblr.
→ All images on sinxcosx.tumblr.com
→ Explanation on Github
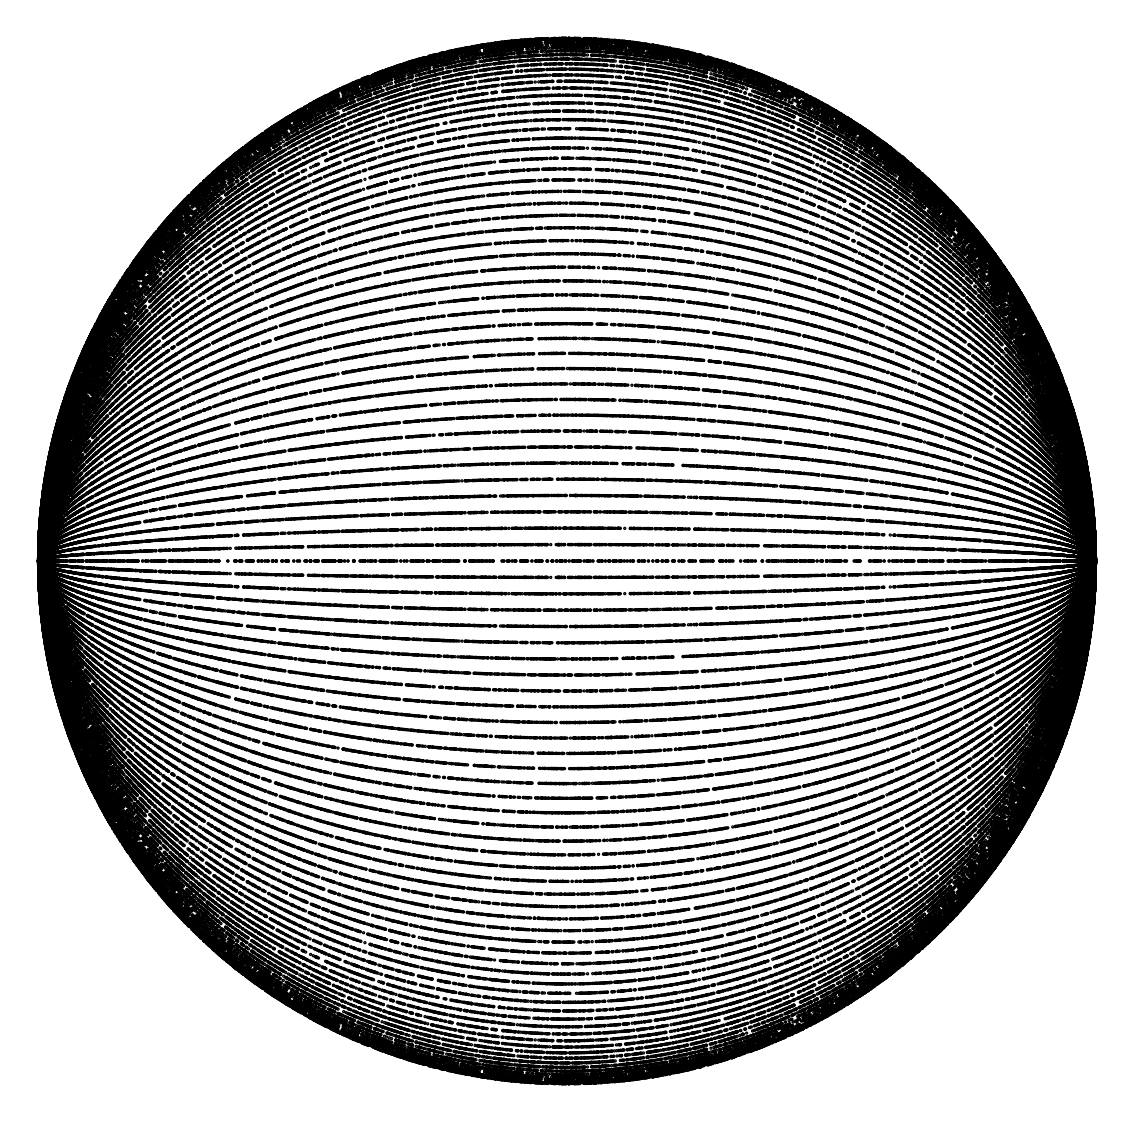
The following image shows all plots I uploaded to Tumblr:


Comments